Category: Analytics
What Is Digital Shelf Analytics? A Guide for Brands
Digital shelf analytics explained: the KPIs (share of search, availability, price, content, reviews), how the data is collected and normalized, and how brands act on it.
Table of Contents19
What Is Digital Shelf Analytics?
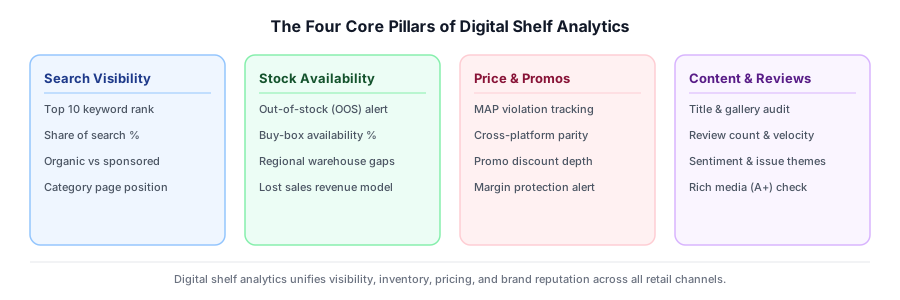
Digital shelf analytics (DSA) is the continuous measurement of how your products appear and perform across every online retailer and marketplace that sells them — search rank, price, availability, content accuracy, ratings, and reviews — captured per listing, per retailer, and per point in time. Where a store manager once walked the aisle to check facings and stock, digital shelf analytics does the same across hundreds of online storefronts at once and turns what it finds into a data feed brands can act on.
A single observation is one metric, for one product, on one retailer, at one moment. Repeated on a fixed cadence across an assortment, those observations become a time series — the raw material for share of search, out-of-stock trends, and MAP compliance. The difference between usable digital shelf data and a pile of scraped numbers is normalization: the same product identified across retailers that name it differently, list price separated from promotion, and a timestamp on every row.
The Digital Shelf, Explained
The "digital shelf" is where online shoppers discover, compare, and buy — retailer search results, category pages, product detail pages, and marketplace listings. It is the online equivalent of the physical shelf, except there is no single aisle you can walk. Your product sits in hundreds of storefronts simultaneously, each with its own ranking, price, content, and reviews, all changing independently and constantly. Digital shelf analytics is how a brand sees that shelf as one picture instead of hundreds of browser tabs.
Core Digital Shelf KPIs
Digital shelf analytics tracks a consistent set of metrics across every retailer so they can be compared and trended over time.
Share of search and share of shelf
The percentage of top search results your products occupy for a given keyword, compared with competitors. It is the closest online equivalent to shelf facings and the leading indicator of discoverability.
Availability and out-of-stock rate
Whether each listing is in stock, across every retailer. Out-of-stock is lost sales you never see in your own data, because the shopper simply buys a competitor's product instead.
Price and MAP compliance
The advertised price per listing and per seller, checked against your Minimum Advertised Price policy. Violations erode margin and channel trust, and they are only visible if you watch every reseller.
Content and image compliance
Whether the title, bullets, description, and images on each listing match your brand standard. Incomplete or wrong content quietly suppresses both conversion and search rank.
Ratings and reviews
Average rating, review count, and sentiment aggregated by SKU and retailer. Reviews are both a conversion driver and an early-warning system for product or fulfilment problems.
Buy Box ownership
On marketplaces with multiple offers, who wins the Buy Box on your listings — and whether that is you, an authorized reseller, or an unauthorized one.
How Digital Shelf Data Is Collected
Digital shelf analytics runs on a repeating pipeline: crawl the relevant retailers and marketplaces, match every listing to the correct product in your catalogue, normalize the fields into one schema, and stamp each row with a timestamp. Matching is the make-or-break step — the same product is titled differently on every site, so accurate product matching is what separates a comparable data feed from noise.
- Crawl: retailer search results, category pages, and product detail pages on a set cadence
- Match: each listing mapped to your SKU, with or without a barcode, and a confidence score
- Normalize: prices, availability, and content mapped into one consistent schema
- Timestamp: every observation dated so the data becomes a trend, not a snapshot
How Brands Use Digital Shelf Analytics
Because the data is normalized and continuous, different teams read the same feed for different decisions.
- E-commerce and marketing: improve share of search, fix content gaps, and prioritize retail-media spend
- Supply chain and sales: catch out-of-stocks early and quantify the revenue at risk
- Brand protection: enforce MAP, spot unauthorized sellers, and defend the Buy Box
Digital Shelf Analytics vs. MAP Monitoring vs. Price Monitoring
These three overlap but are not the same. MAP monitoring is a focused check on whether resellers advertise below your minimum price. Price monitoring tracks competitor prices to inform your own pricing. Digital shelf analytics is the widest of the three: price is just one of its KPIs, sitting alongside search rank, availability, content, and reviews. If price is the only question, price monitoring is enough; if you need the whole picture of how your brand performs online, that is the digital shelf.
- MAP monitoring: is anyone advertising below my minimum price?
- Price monitoring: what are competitors charging, and how should I respond?
- Digital shelf analytics: how do my products rank, convert, and stay available everywhere they sell?
Getting a Digital Shelf Data Feed
Most brands do not want to build and maintain crawlers, matching models, and normalization pipelines in-house. A managed digital shelf analytics data feed delivers the KPIs above — share of search, availability, price and MAP compliance, content, and reviews — normalized and ready to load into your BI stack, so your teams spend their time acting on the shelf rather than assembling the data.
Frequently Asked Questions
What is digital shelf analytics?
Digital shelf analytics is the continuous measurement of how your products appear and perform across online retailers and marketplaces — search rank, price, availability, content, ratings, and reviews — normalized into a single data feed. It replaces manual spot checks with daily, comparable metrics across hundreds of storefronts.
What is share of search?
Share of search is the percentage of top search results your products occupy for a given keyword compared with competitors. It is a core digital shelf KPI and the leading indicator of online discoverability.
What KPIs does digital shelf analytics track?
The core KPIs are share of search and share of shelf, availability and out-of-stock rate, price and MAP compliance, content and image compliance, ratings and reviews, and Buy Box ownership on marketplaces.
How is digital shelf analytics different from MAP monitoring?
MAP monitoring answers one narrow question — is anyone advertising below your minimum price. Digital shelf analytics is far broader: price is just one of several KPIs it tracks alongside search rank, availability, content, and reviews.
How often is digital shelf data refreshed?
Refresh cadence is set per category. Volatile marketplace listings can be checked several times a day, while stable long-tail assortments are refreshed daily or weekly.
Where this fits in the platform
Terms in this article

Strategic Lead, Senkrondata
Kerem leads strategy at Senkrondata, with years of experience in data engineering and market analysis.
Contact Us
Leave your email address for a detailed demo or overview session, and we will get back to you shortly.