
Category: Analytics
How Do You Measure Digital Shelf Visibility? Turning Shelf Share Into Numbers
How is digital shelf visibility measured? How Senkrondata combines ranking, content and stock signals into one concrete visibility score.
Table of Contents5
In a physical store, "shelf share" is concrete: is it at eye level, at the head of the aisle, how many meters does it occupy? The same concept exists online but it's invisible — you can't see at a glance whether a product sits "in a good spot" or is lost somewhere a user will never scroll to. Digital shelf analytics is the effort to make that invisible position measurable.
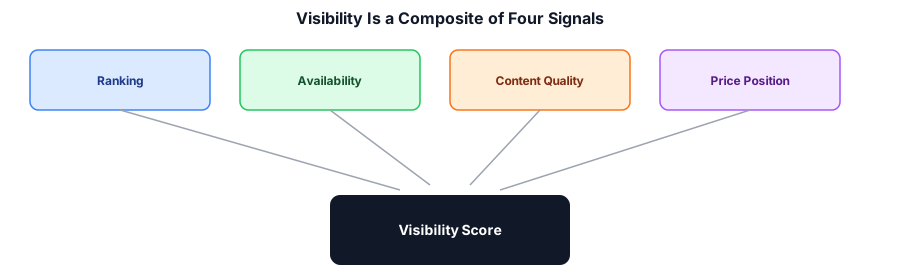
The catch is that "visibility" isn't a single number — it's a composite of several signals. Measuring it means collecting the right signals separately and combining them meaningfully.
The signals that make up visibility
- Ranking / position: where does a product show up in relevant searches or on a category page? (See marketplace ranking tracking.) This is the most direct measure of "findability."
- Availability: is the product in stock? A perfect ranking is worthless if it's out of stock. (See out-of-stock tracking.)
- Content quality: does the product have images (how many), is the description sufficiently filled out, are attributes (color, size, brand) complete? Thin content makes a product technically "there" but practically invisible.
- Price positioning: where does the product's price sit within its category — this indirectly affects click and conversion likelihood too.
None of these alone is "visibility"; together they describe how much space a brand occupies on the digital shelf.
Turning shelf share into a number
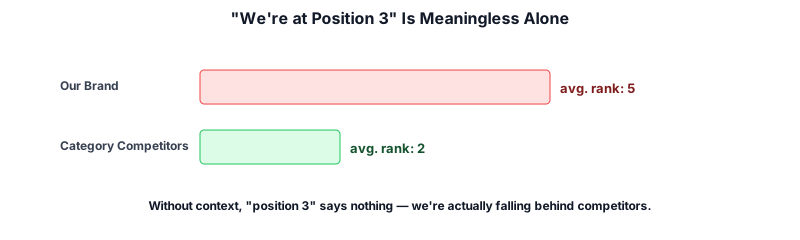
What makes these signals meaningful is positioning them relative to a brand's competitors in the same category. A single product being "at position 3" is an empty fact; "competitors in this category average position 2, we're at 5" is a call to action.
To scale this, visibility data is aggregated from product level up to category/brand level: a brand's average ranking across all its products in a given category, its in-stock rate, its content-completeness score — these become KPIs tracked over time.
What digital shelf data drives
- Content prioritization: which products are missing images/descriptions, and which category loses the most from that gap?
- A category-level competitive map: where a brand is strong and where it's weak — where is shelf share being won, where is it being lost?
- Investment prioritization: should a limited marketing/content budget go to the categories with the biggest visibility gap, or to categories where the brand is already strong?
The principles that keep it trustworthy
- Visibility is measured relatively. A number carries no meaning without being contextualized against category competitors.
- Signals shouldn't mask each other. Perfect content but no stock, or perfect ranking but empty content — neither is "good visibility"; the composite stays low.
- Measurement must be consistent over time. A "visibility score" not measured repeatedly with the same methodology produces noise, not a trend.
The bottom line
The digital shelf looks less tangible than a physical one, but it's just as real a competitive space. Combining ranking, availability, content, and price signals and measuring them at the category level turns "how visible is our brand in this category?" into a concrete, actionable answer.
If you want to turn your digital shelf share into numbers, talk to the Senkrondata team.
Where this fits in the platform
Price Intelligence & Data Engineering
Emre writes about the machinery behind competitor price data: product matching, normalization, collection at scale and the analytics layer on top.
Contact Us
Leave your email address for a detailed demo or overview session, and we will get back to you shortly.