
Category: Analytics
How to Measure Restaurant Customer Satisfaction
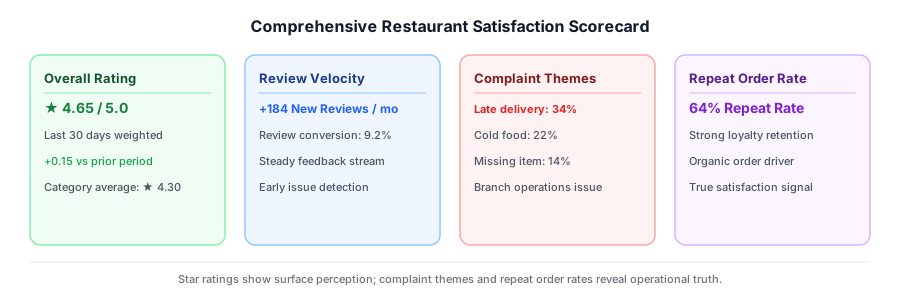
Measuring satisfaction is not the same as reading your platform rating. Why the rating is biased, which leading indicators to use, and a per-branch scorecard.
Table of Contents20
Ask how to improve customer satisfaction and the answers converge on one list: friendly service, cleanliness, quality food, speed, a loyalty programme.
Nothing on that list is wrong. But there is a problem with it: every item is something you already believe you are doing.
No restaurant opens in the morning intending to send out cold food. The problem is not intent, it is visibility: you do not know which branch, which menu item, which hour of the day is falling below expectation.
So the first step in improving satisfaction is not a list of advice. It is a measurement system.
And measurement does not start where most restaurants assume it does.
Your Platform Rating Is Not a Satisfaction Measure
Most operators equate satisfaction with a single number: the platform rating.
That number matters, because it is the number the customer sees. But it is not a measure of satisfaction — it is a biased sample of it.
The reason is well documented. Work by Nan Hu, Jie Zhang and Paul Pavlou, published in Communications of the ACM, examines why online review distributions are J-shaped: the large majority of reviews cluster at the very high and very low ends, with few ratings in the middle.
According to the study, two self-selection biases drive that distribution:
Purchasing bias. People who already value a product are the ones who buy it. Those who expect not to like it never order, and so never write a negative review. This pushes the average upward.
Under-reporting bias. Among those who do buy, people holding extreme views — very satisfied or very dissatisfied — are more likely to express them. Someone who had a perfectly ordinary experience usually writes nothing at all.
What this means for a restaurant: your rating does not represent the majority who quietly ate their food and moved on. It represents the extremes.
None of which makes the rating unimportant — customers decide by looking at that number, so it is commercially critical. But "our rating is 4.3" does not mean "our customers' satisfaction is 4.3."
The Rating Is Also a Lagging Indicator
The second problem is timing.
When a customer has a bad experience, the chain runs: order → experience → review, if any → effect on the score → visibility in the average.
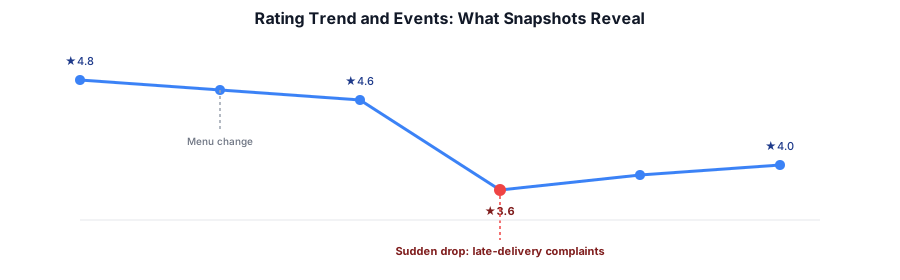
By the time you notice the problem at the end of that chain, dozens of orders carrying the same fault have already gone out. The rating tells you what happened. It does not tell you what is happening.
A workable measurement system therefore separates two kinds of indicator:
| Leading indicators (early warning) | Lagging indicators (outcome) |
|---|---|
| Gap between estimated and actual prep time | Platform rating |
| On-time delivery rate | Review count and distribution |
| Missing or incorrect order rate | Share of negative reviews |
| Cancellation and refund rate | Repeat order rate |
| Hours closed due to capacity | Category rank |
| Number of sold-out items | Rating gap against competitors |
The left column moves today; the right column moves weeks later. A business watching only the right column always manages in retrospect.
This split mirrors a familiar one on the data side; we cover why operational and analytical layers are built separately in operational vs analytical data.
Measure Satisfaction From Four Sources
Measurement resting on a single source is always biased. A system that works reads four together.
1. Platform rating and reviews
What it gives: The number the customer sees, a scale comparable against competitors, and reasons in the free text. Its limit: Biased sample, lagging, platform-specific.
The free text is in fact more valuable than the score itself, because it carries the cause. We set out how to group it into themes in managing negative reviews on delivery apps.
2. Operational leading indicators
What it gives: Immediate, full sample, directly actionable. Its limit: Measures what the customer experienced, not what they felt.
On-time delivery rate is not a satisfaction measure. But it is the strongest available predictor of dissatisfaction, and it can be measured today.
3. Repeat order rate
What it gives: A behavioural signal — the most honest one. Its limit: Accumulates slowly, and is disturbed by outside factors such as promotions or a competitor opening.
A customer may not write a review, but never ordering again is also an answer. This is the one indicator that lets you read the silent majority.
4. Direct feedback
What it gives: A controlled sample, and the ability to ask the question you actually want answered. Its limit: Low response rates; needs setup and consistency.
A short post-order question, a QR-code mini survey on the table, or call-centre feedback all sit here. Keeping it to a single question raises the response rate substantially.
Reading all four matters because each covers another's blind spot: the rating is biased but comparable; operational metrics are unbiased but do not measure feeling; repeat rate is honest but slow; surveys are quick but small.
A Per-Branch Satisfaction Scorecard
A brand-wide satisfaction score is not a manageable thing. Measurement has to be broken down by branch.
A scorecard that works usually has this structure:
Experience column
- On-time delivery rate
- Average prep time and its variance
- Order accuracy rate
Perception column
- Current rating
- 7- and 30-day rating change
- Share of negative reviews and the dominant theme
Loyalty column
- Repeat order rate
- Average basket trend
Competition column
- Average competitor rating in the zone
- Rating gap against competitors
The value of this scorecard is not in the individual metrics. It is in the inconsistencies between columns.
If a branch has a strong experience column but a weak perception column, the problem is not in the kitchen — it is in expectation management: the delivery estimate may be understated, the product photo may oversell the portion, or the menu description may mislead.
The reverse happens too: if the perception column still looks fine while the experience column deteriorates, the rating has not fallen yet but it will. That is exactly where early warning earns its keep.
Is 4.3 Good? Not Answerable Without Competitors
The most common mistake in satisfaction measurement is treating the score as an absolute value.
Say your branch sits at 4.3. Is that good?
- If competitors in the zone run 3.8–4.1, it is a strong performance
- If they run 4.5–4.7, the same number is competitively weak
The customer does not know what your rating was last year. They know the alternatives on the screen in front of them. So the last column of the scorecard — competition — is as necessary as the other three.
The same logic applies across time. Two of your branches may both sit at 4.2 today; one climbing from 3.9, the other falling from 4.6. Same number, opposite situations.
Close the Measurement Loop
The purpose of measurement is not to produce a report. It is to learn whether an intervention worked. The loop has four steps:
- Measure. Produce the scorecard by branch.
- Narrow. Reduce the largest deviation to a single branch, item or time window.
- Intervene. Change one thing — change three at once and you will not know which worked.
- Re-measure. Same metric, same breakdown, after a defined interval.
Step four is the one most often skipped. If nobody checks whether complaints in that theme actually fell after the intervention, the system is not a measurement system. It is a reporting habit.
One note: the loop only works if the data is fresh enough. Deciding weekly does not make weekly-refreshed data sufficient — the age of the data at the moment of decision sets the quality of the decision. We treat this in data freshness is an SLA.
Common Measurement Mistakes
Looking only at the average. In a 50-branch chain, a 4.3 average can conceal 35 branches at 4.6 and 5 branches at 3.7. You manage the distribution, not the average.
Ignoring review counts. A 4.8 across 8 reviews and a 4.4 across 600 do not carry the same reliability.
Mixing promotional periods with normal ones. The customer profile during a discount period differs; that period's rating may not represent normal performance.
Watching a single platform. The same branch can hold different ratings on two platforms. Whether the gap comes from the platform's user base or from your operation can only be separated by watching both. We cover modelling channel and location together in delivery platform intelligence.
Measuring only when things go wrong. Analysis that begins when the rating drops has no historical data to compare against. Measurement has to be continuous so that "what changed?" is answerable at the moment of the drop.
Track Satisfaction by Branch and by Theme
Building the scorecard above requires the external data layer to be collected regularly: platform ratings, reviews, competitor performance, and how all of it moves over time.
Senkrondata food delivery intelligence supplies that layer:
- Rating and review tracking by branch and platform
- Classification into complaint themes
- Trend and event detection across a time series
- Competitor comparison by zone
- Alerts when thresholds are crossed
For a branch yet to open, measurement starts before the doors do; mapping the zone's competitive landscape is covered in launching on a food delivery marketplace, and how satisfaction converts into orders in how to increase orders on delivery platforms.
With Senkrondata you can:
- Build a rating and review scorecard by branch
- Track complaint themes and how they shift
- See your performance relative to competitors
- Measure the result after you intervene
Frequently Asked Questions
How do you measure customer satisfaction in a restaurant?
No single source is sufficient. A working system reads four together: platform ratings and reviews, operational leading indicators (on-time delivery, order accuracy, prep time), repeat order rate, and direct feedback. Each source covers another's blind spot.
Does the platform rating reflect customer satisfaction accurately?
Not quite. Online reviews carry two self-selection biases: people who already value the product are the ones who order, and those with extreme views are more likely to write. The study of this distribution shows reviews cluster in a J-shape. The rating is commercially critical because customers decide by it, but it is not an unbiased measure of satisfaction.
What is the difference between leading and lagging indicators?
Leading indicators move today and can be acted on directly: on-time delivery rate, prep-time variance, missing order rate. Lagging indicators show the outcome and move weeks later: platform rating, share of negative reviews, repeat order rate. A business watching only lagging indicators always manages in retrospect.
Why does repeat order rate matter?
Most customers never write a review. Not ordering again is the silent majority's answer. That makes repeat order rate the most honest indicator of how the non-reviewing segment feels. Because it accumulates slowly and is disturbed by promotions, read it alongside the other indicators rather than alone.
Is a 4.3 rating good?
It depends on your zone. If most competitors run 3.8–4.1, 4.3 is a strong performance; if they run 4.5–4.7, the same number is competitively weak. The customer does not see your rating history — they see the alternatives on the same screen.
Should I run a satisfaction survey?
Direct feedback is valuable because it gives a controlled sample, though response rates are typically low. Limiting the survey to a single question raises the response rate substantially. Treat it as a complement to platform reviews, not a replacement.
How often should I measure?
Measurement frequency follows decision frequency. If you act weekly, the data has to be fresher than the weekly decision. And do not start measuring only when the rating falls: without historical data to compare against, "what changed?" cannot be answered.
Where this fits in the platform

Co-Founder & CEO
Okan Bircan is the Co-Founder & CEO of Senkrondata, leading data-driven growth for enterprises across e-commerce and price intelligence.
Contact Us
Leave your email address for a detailed demo or overview session, and we will get back to you shortly.