
Category: Analytics
How to Increase Orders on Food Delivery Platforms
Growing orders is not one problem but four. Measure visibility, card clicks, add-to-cart and completion separately, and pull the lever that actually moves.
Table of Contents21
Most advice on this subject converges on the same list: take good photos, write better descriptions, run promotions, deliver quickly.
None of it is wrong. All of it rests on one assumption: that orders fall for a single reason.
But "our orders are down" is not a diagnosis. The same sentence can point to four entirely different problems:
- You may be appearing lower in the list
- You may be appearing but not getting clicked
- You may be getting clicked but losing people inside the menu
- Carts may be filling but not converting into orders
Each has a different lever. Changing your photos will not fix the first. Launching a promotion will not fix the fourth.
This article treats order growth not as a list of tactics but as a four-stage funnel.
Build the Funnel First
An order on a delivery platform passes through this chain:
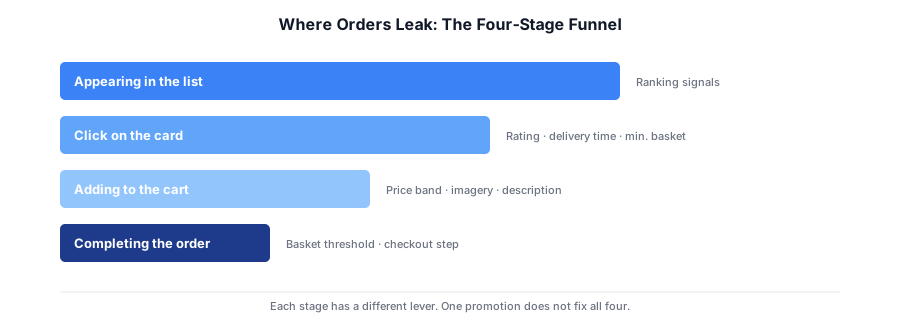
Each stage has its own measure and its own intervention. An improvement made without knowing which stage is losing you orders is applied in the wrong place, even when the improvement itself is correct.
Let us take the stages one at a time.
Stage 1: Appearing in the List
When a customer opens the app, they get a list of restaurants. The difference between sitting near the top and sitting on the third page outweighs every other improvement you can make. Your menu may be excellent — it does not matter if nobody reaches that page.
So what determines the ranking?
There is a great deal of speculation on this online. It is more productive to read what the platforms themselves publish. Yemeksepeti's merchant agreement states that restaurant listing and ordering may draw on:
- Opening hours
- Distance to the user
- Delivery time
- The size of the discount applied
- Number of orders received
- Reviews and ratings
- Click count
Two things are worth noting when you read a list like this.
First: the weights are not disclosed. So "raise my rating by 0.2 and I move up three places" is not a claim anyone can make. Treat content that states such precise relationships with caution.
Second: several of these parameters are directly within your control. Opening hours, delivery time and discount level are operational decisions. Rating and order count are outcomes — you cannot set them directly, but you influence them by fixing the others.
Distance to the user is the one item you cannot change in the short term. That makes your delivery zone definition consequential: a very wide zone shows you to more distant users, but it can lengthen your delivery time and damage two other parameters in the process.
Reading rank this way is not unique to food delivery; we cover the same logic for marketplaces in where do you rank.
Stage 2: Getting the Card Clicked
If you appear in the list but are not clicked, the problem is not your ranking. It is your card.
In the list, the customer sees only a handful of facts about each restaurant:
- Name and image
- Rating and review count
- Estimated delivery time
- Minimum basket value
- Delivery fee
- A promotion badge, if any
The decision is made on those six items, in seconds. Nothing about your menu is visible yet.
Each item on the card is therefore its own lever:
Rating. The heaviest item, and the slowest to move. When the rating falls, clicks fall with it. For recovery methods see our guide to improving restaurant ratings.
Delivery time. Showing 50 minutes while competitors show 25–30 is a serious disadvantage in the same list. There is a trap here: understating the estimate raises clicks, but every late delivery then converts directly into a negative review. What you gain in the short term you give back through the rating.
Minimum basket value. If competitors sit at one level and you set yours materially higher, you eliminate every single-person order.
Promotion badge. The fastest way to stand out visually in a list — and the most expensive.
Stage 3: Adding to the Cart
The customer opened your menu and left. Losses at this stage usually come from three causes.
Price band
Customers do not evaluate your menu in isolation. They compare it against the three restaurants they looked at a minute ago. If your prices sit visibly above the band, they leave.
The critical point: your price is set by the alternatives on the same screen, not by your cost base. If you are not tracking how competitor prices move over time, a position that was correct at launch can quietly become wrong within months. We cover that transition in turning competitor data into pricing action.
Imagery and descriptions
Here the conventional advice is right: good photography and a substantial description do work. But the effect is confined to this stage — it will not repair your ranking or your card click-through.
Sold-out and unavailable items
This is the most underrated item on the list. If the dish the customer came for shows as unavailable, that visit will probably not become an order.
And the information is not only a loss, it is a signal: which items sell out, and how often, carries data about both demand and capacity. We treat that idea more generally in out of stock is a signal too.
Stage 4: Completing the Order
The cart filled but no order arrived. Losses here usually reduce to a short list:
- The minimum basket value was not reached
- The delivery fee was high relative to the basket total
- The estimated delivery time grew at the last step
- Something failed at payment
The first two are design decisions, and they are linked. Raising the minimum basket lifts your average order value but lowers your completion rate. Which is more profitable varies by business — and is only settled by measuring.
A practical method: look at the share of carts that stop just below your minimum. If that share is high, your threshold is cutting off demand. Adding small completer items — drinks, sauces, dessert — is usually more profitable than lowering the threshold.
When Does a Promotion Work, and When Does It Just Burn Margin?
Promotions bring orders. The question rarely asked is: which stage does this fix?
A promotion badge raises card clicks, and discount level is one of the ranking parameters. So promotions genuinely work at stages one and two.
At stages three and four a promotion is a cover. If your menu prices sit above the band, a discount hides that temporarily; when the promotion ends, the problem returns intact. Likewise, if your minimum basket threshold is too high, a discount does not fix a completion problem.
When you evaluate a promotion, keep two numbers apart:
- The order difference between promoted and un-promoted days
- The gross contribution per order on promoted days
If the first is rising while the second falls, the promotion is buying order volume. That can be a deliberate choice — it is sensible for a new restaurant collecting its first ratings. As a permanent strategy it is not sustainable.
Be careful when benchmarking competitor promotions, too: not every discount you see in a list is a real one. Raising a price and then displaying it as discounted is a common pattern, and separating genuine discounts from cosmetic ones takes its own analysis.
The Hours You Are Closed Are a Silent Loss
Your order report shows the orders you received. What it does not show is the orders that never arrived because you were closed.
That loss takes two forms.
Planned closure. Your opening hours may not cover the window where demand exists. If the number of open restaurants in your zone drops after 11pm, that window is where competition is thinnest.
Unplanned closure. Manually pausing orders, or stretching the delivery estimate, because the kitchen cannot keep up at peak. These manage the immediate crisis, but they directly affect two ranking parameters — opening hours and delivery time.
You already know your own closed hours. What you do not know is when your competitors are closed — and that is where the opportunity sits.
"Orders Are Up" Needs a Competitor Benchmark
Say your orders rose 12% month on month. Is that good news?
It depends on what happened in your zone:
- If zone-wide demand rose 20%, you are actually losing share
- If zone-wide demand was flat, 12% is a real gain
- If a new competitor opened and you still grew, that is a stronger result again
Looking at your own number alone leaves you unable to tell these three cases apart.
So the metric set worth tracking does not stop at your own data:
| Your metrics | Competitor metrics |
|---|---|
| Order count | Competitor ratings and review counts |
| Average basket | Competitor menu prices |
| Rating and review trend | Active competitor promotions |
| Your category rank | Number of restaurants in the zone |
| Hours spent closed | Hours competitors stay open |
What to Track Weekly
Daily checking produces noise; monthly checking arrives too late. A weekly rhythm is the right interval for most restaurants.
Answer these four questions every week:
- How did our average rank in the category list change versus last week?
- Did our rating gap against competitors widen or close?
- Where do our menu prices sit in the zone band — did competitors raise prices?
- Which stage got worse: visibility, clicks, add-to-cart, or completion?
The fourth question matters most, because it decides the week's action.
See Competitor Moves Without Waiting for Them
Every analysis in this article rests on one precondition: knowing, on a regular basis, the ratings, menu prices, promotions and opening hours of the competitors in your zone.
With one location you can do that by hand. At five locations across two platforms it means ten separate pages, each with dozens of competitors on it.
Senkrondata food delivery intelligence centralises that tracking:
- Competitor ratings and review trends by zone
- Menu prices and price movements
- Active promotions and promotion history
- Comparison across locations and platforms
Because the data comes from the app itself, the picture matches what the customer sees; we describe the method in how mobile app scraping works.
With Senkrondata you can:
- Track your rank and your competitors' rank
- Position your price band against the real market
- See competitor promotions the moment they go live
- Compare performance across locations and platforms
Frequently Asked Questions
How do you increase orders on a food delivery platform?
Not through a single intervention, but by finding which stage is losing you orders. Appearing in the list, getting the card clicked, adding to the cart and completing the order have different levers. Measure where the loss is first, then act on that specific stage.
What determines restaurant ranking on a delivery platform?
Yemeksepeti's merchant agreement states that listing and ordering may use opening hours, distance to the user, delivery time, discount level, order count, reviews and ratings, and click count. The weights applied to these parameters are not disclosed.
Do promotions increase orders?
Promotions raise card click-through, and discount level is one of the ranking parameters, so they are effective at the first two stages of the funnel. If your menu prices sit above the market band or your minimum basket is too high, a promotion does not solve the problem — it only covers it temporarily.
Does showing a shorter delivery time help?
A shorter estimate raises click-through. But if the displayed time is materially shorter than the actual time, late deliveries convert into negative reviews and the rating falls. Since rating affects both ranking and click-through, a short-term gain can become a medium-term loss.
Should I lower my minimum basket value?
First look at the share of carts that stop just below the minimum. If that share is high, your threshold is cutting off demand. In most cases adding small completer items is more profitable than lowering the threshold, because it protects average basket while improving completion.
How do I measure order growth correctly?
Looking at your own order count alone is misleading. If zone-wide demand grew faster than yours, you are losing share. Evaluate your metrics alongside competitor ratings, competitor prices and the number of restaurants in your zone.
How often should I check?
Daily checking produces noise and monthly checking arrives too late. A weekly rhythm suits most restaurants: category rank, rating gap against competitors, position in the price band, and which funnel stage deteriorated.
Where this fits in the platform

Co-Founder & CEO
Okan Bircan is the Co-Founder & CEO of Senkrondata, leading data-driven growth for enterprises across e-commerce and price intelligence.
Contact Us
Leave your email address for a detailed demo or overview session, and we will get back to you shortly.